Sixty monthly tabs, rebuilt as one solar performance report
A UK solar company's site reports came out of a workbook that had grown by accretion since 2022. Rebuilt on a single daily-data table with Power Query and a Power Pivot data model, branded, exportable to PDF in one click, then extended with safety, security, spares and maintenance tracking.
The problem
A UK solar company produces a performance report for each of its sites every month. The workbook producing it had grown the way these things do: a main dashboard sheet built up over years, heavy on merged cells, and more than sixty monthly tabs going back to the start of 2022, plus a leftover set of unnamed month tabs from an earlier template. The columns had drifted between versions, so older months had nine and newer ones eight. It worked, in the sense that a report came out of it, but every month was a long manual task for the managers, and nothing about it looked like the company’s brand.
The brief called it an update. It was a rebuild. Of the report sections the client wanted, roughly half existed in some form and the rest had to be built from nothing.
What I built
One table in, everything else derived
The rebuild starts with a single daily-data input table instead of a tab per month. Power Query takes that table, cleans out duplicate days on the way in, and loads it into the workbook’s data model.
A data model, not a sheet of formulas
That data model is the part that does the work. In Power Pivot the daily data sits against a proper date table, so report-period figures, year-to-date and rolling twelve-month totals are all measures over the same rows, rather than formulas pointed at sixty different tabs. Ask for a different period and the same measures answer; add a new month and nothing needs re-pointing. Generation against target, specific yield and performance ratio are each written once as DAX measures, and every page of the report reads from them: the headline figures are CUBEVALUE formulas pulling straight from the model, and the charts are built on the model too. There is no hidden sheet of helper formulas to break.
The report itself
- A title page with the site information and the client’s brand applied throughout: logo, colour palette and typography.
- A report-period summary: generation against target, specific yield, and performance ratio actual against target.
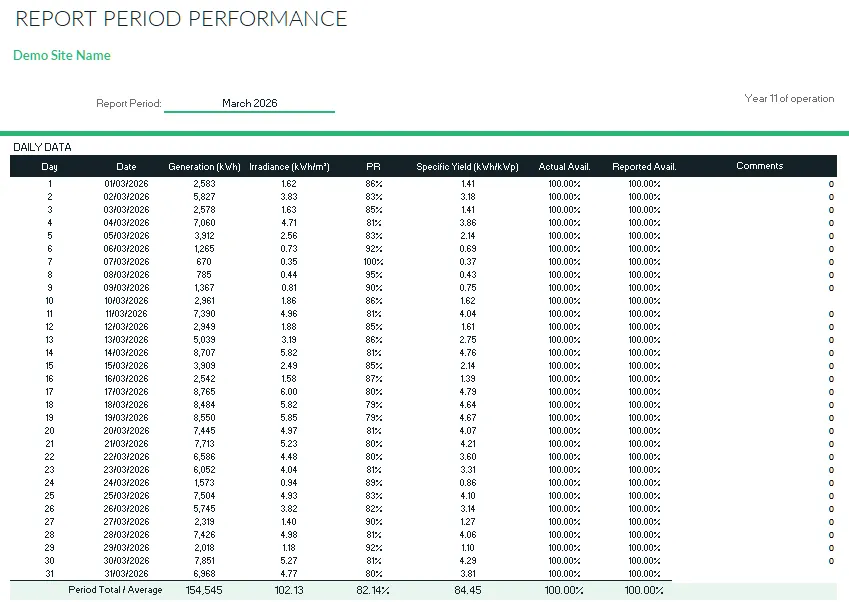
- Report-period performance: the daily data table and a generation against irradiance chart.
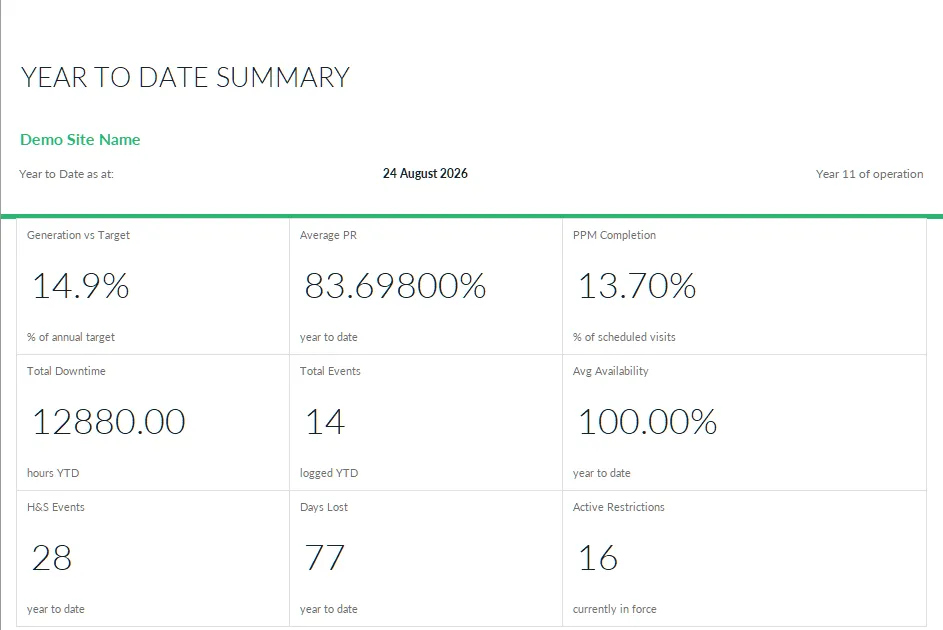
- Year-to-date performance: rolling twelve-month totals and trend charts.
- An events log, a structured input table for downtime and maintenance, with a Gantt-style view of downtime on the events page.
The year-end button
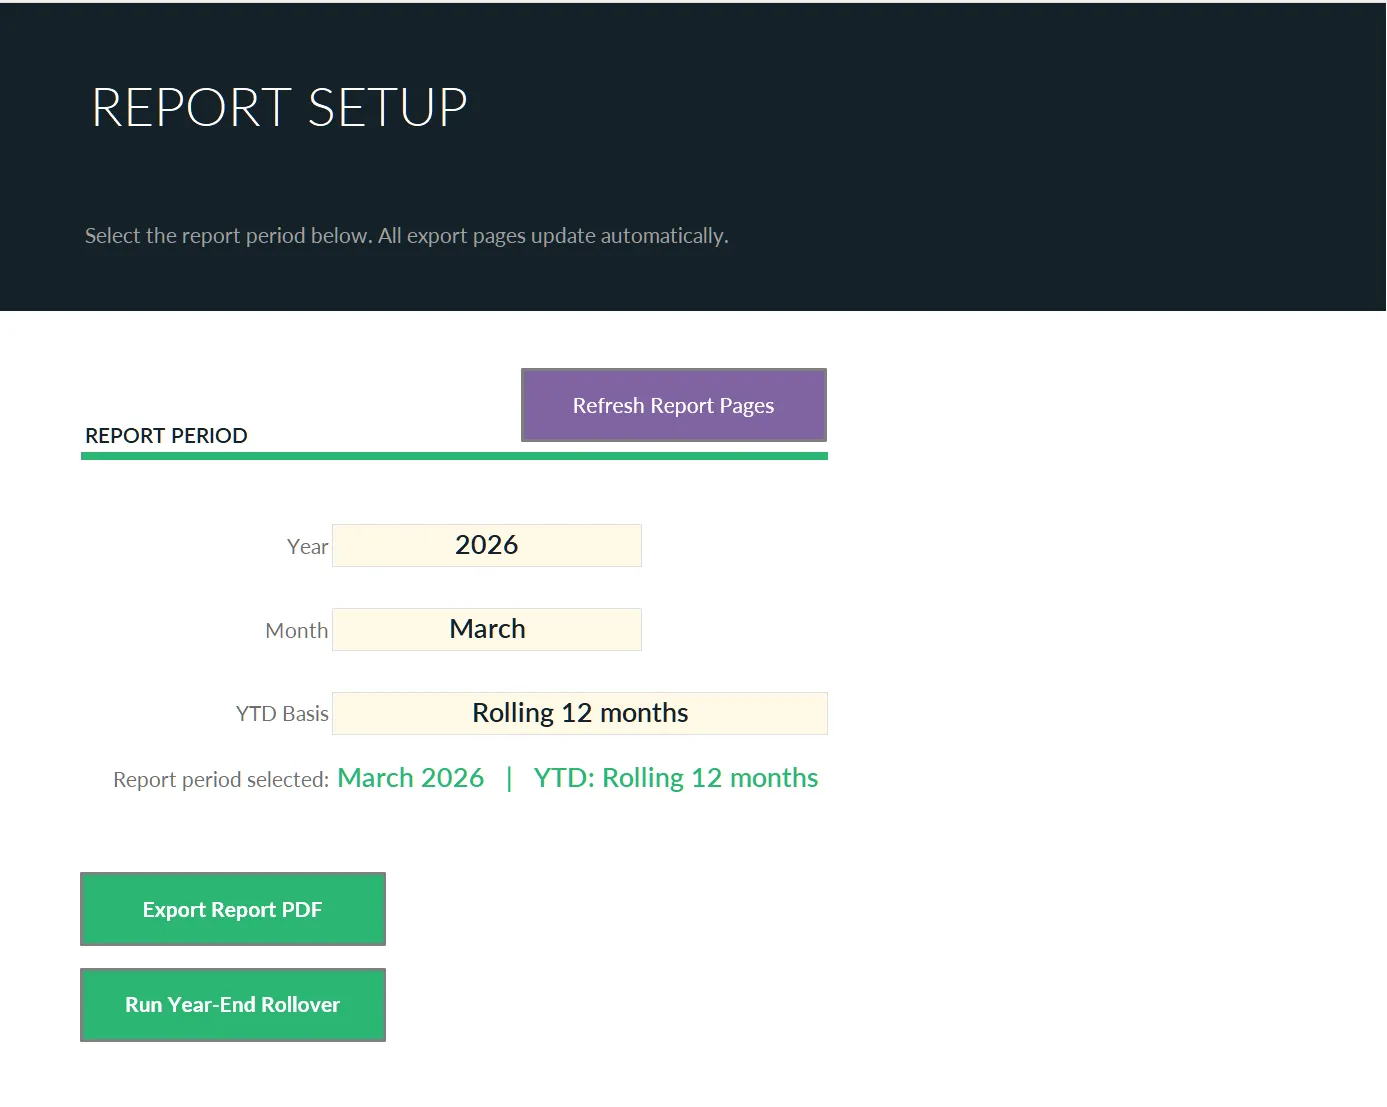
Solar reporting runs on a rolling year, so I added a year-end rollover button. It trims the data to the last twelve months, clears the events log and sets the workbook up for the new reporting year.
Sections that didn’t exist before
The client came back for a second phase, which added the parts of the report that had never had a home in the old workbook:
- Health and safety: incidents, near misses, accidents and operational restrictions.
- Site security: CCTV status with evidence, an activation log and general security notes.
- A spare parts tracker: what’s on site now, and budget against actual.
- A rebuilt planned preventive maintenance tracker, with every scheduled task pulled from the contract appendices and tracked by date and completion.
- A yearly summary report.
Handing it over
The report has a PDF print layout for one-click export of the whole thing, a written user guide, and a demo video walking through data entry, the monthly process, the year-end rollover and the export. The workbook is meant to be run by the people on site, not by me.
The result
Monthly reporting for each site now runs from one daily-data table into a branded, exportable report, with the events, safety, security, spares and maintenance records that used to live elsewhere, or nowhere, in the same place. What was a long monthly task for the managers is now a much smaller one. The first phase was delivered in six days, and the client came back for the second.
Chris delivered ahead of schedule, on budget and exceeded expectations :)
The client, Fiverr review, May 2026
Got a job that sounds like this?
Let's talk about what you need